

Approach
Initially, Möbius supported the BeWaPP team in considering the scope of this dashboard in order to develop a balanced performance management system. The aim was to create a framework for the development of the dashboard on different levels: the scope of the dashboard, the target audience, the different types of performance indicators preferred, the right level of presentation and depth... To keep the dashboard at a strategic level, it was important to prioritise the priority missions and objectives for the activities and projects with the greatest impact.
Several workshops were then organised with BeWaPP staff were then organised to identify the most appropriate performance indicators for each of the predefined priority objectives. The indicators were chosen to be motivating for the organisation and easy to measure. After several brainstorming sessions, a final selection was made with the steering committee members. From the list of potential indicators, only those with the highest strategic value were included in the dashboard. Certain "future" indicators that will only be measurable in the coming years were also taken into account.
One of the main challenges in this phase was to distinguish between the indicators covered by the main dashboard (developed as part of this mission) and those that will find their place in thematic dashboards that respond to more specific needs (new initiatives, campaigns that require special monitoring, deepening of a theme, topic...) that may change over time. The identified indicators were therefore split between these two categories.
Then, on the one hand, the available data from different sources were collected and centralised. Audits were carried out to ensure their quality and integrity. On the other hand, additional data were identified that could be collected in the short term to measure the full performance of BeWaPP.
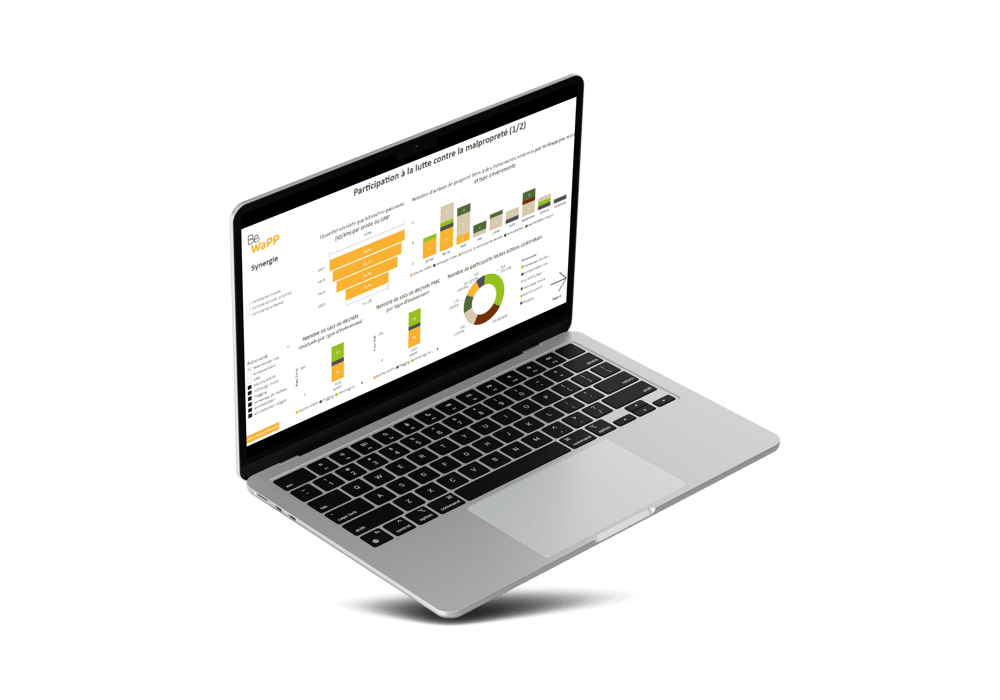
Möbius then provided data analysis and reporting in a dashboard using Power BI. Power BI not only allows for an attractive layout, but also provides a high level of interactivity with the user, allowing them to 'zoom in' and make selections according to their areas of interest. For this purpose, the data sets are formatted, linked and modelled to enable the calculation of indicators. After calculation, these indicators are each provided with a suitable visualisation (bar charts, trend curves, gauges, maps ...). Based on an initial model proposal, Möbius worked closely with BeWaPP's internal project manager to adapt and enrich the dashboard. Several versions were developed and improved, partly based on feedback from the steering committee. Particular attention was also paid to readability and ease of navigation between the different pages of the dashboard.
The dashboard was finally formally presented to the Board of Directors, which appreciated the potential of the tool and subsequently validated the dashboard.
In a final phase, Möbius organised two Power BI sessions for the internal project manager to further complete and update the dashboard on his own.
Results
The BeWaPP team can work easily and independently with the dashboard thanks to Power BI. With this dashboard, BeWaPP can visualise its performance indicators (+/- approx. 30) in a clear and appealing way and share them with the board. In this way, management and the board can monitor the progress, results and impact of their activities in a precise and structured way and steer future actions.


.jpg?width=410&height=220&name=iStock-1407807197%20(1).jpg)