Proximus’ data-driven approach to calculate scope 3 GHG emissions

Proximus collaborated with Möbius to choose a supplier for the emission factors database and build a pipeline for scope 3 carbon footprint calculations.

Logo_proximus
Scope 3 emissions

Strategic challenge 

With the arrival of the CSRD regulations, many organisations are looking for sustainable ways to calculate their CO2 emissions, especially the complex Scope 3 emissions, which cover all upstream and downstream CO2 production throughout a product's lifecycle.

Proximus had a process to calculate its Scope 3 CO2 emissions using spend-based emission factors per industry. However, when their database supplier stopped updating the Emission Factors, Proximus saw an opportunity to rethink and improve its process. They needed to select a new provider for emission factors that aligned with their Annual Spend data and implement a sustainable process for yearly calculations.

This would enable them to calculate current emissions, set targets in line with SBTi, and track performance over the years to achieve these targets. Möbius offered the necessary guidance and analytical support to help Proximus navigate this regulatory challenge.


The objective of the project was to incorporate a dynamic database into Proximus' Scope 3 carbon accounting, requiring a good knowledge of available solutions on the market.

Möbius helped us identify the most suitable option and supported the implementation through effective engagement with the database provider and by deploying the appropriate technical competencies required to manage/query a very large dataset.

The professionalism, skills and flexibility of the Möbius team were key to the successful delivery of this challenging project. 

Laurent Crucifix Sustainability Manager Proximus

Approach 

The first goal was to help Proximus choose the best database for Scope 3 emission factors. To do this, Möbius made a clear comparison between different providers. Each one was checked based on important points like how often they update their data, how detailed the data is, and how they calculate emissions.

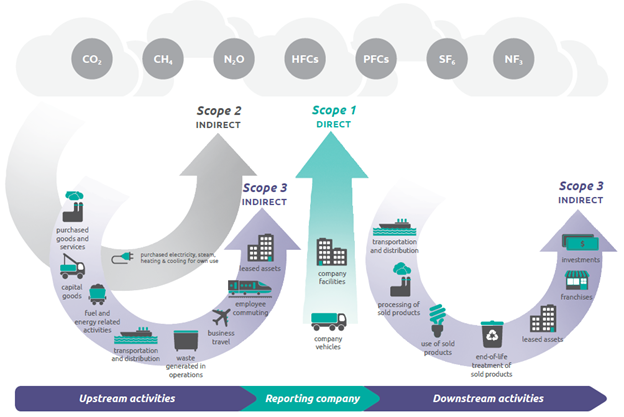
A critical aspect here was the availability of supplier-specific emission factors. While the majority of the providers only provide emission factors on industry category levels (such as NACE or GICS classifications), others also provide these specifically on the supplier level. A coverage check showed that many of Proximus’ suppliers were included in these detailed databases. This means using this more specific data could lead to more accurate results.

 
GHG-Protocol-Scope-Chart

After the new data provider was chosen, a structured and sustainable codebase was developed in Databricks, which allowed for easy access to the necessary databases with the emission factors of the providers. The approach of Möbius consisted of 4 steps:   

1. Supplier identification mechanism

The supplier data from Proximus' procurement team didn’t always match the names or codes used in the emission database. So, Möbius created an automated tool to connect the dots. It matched suppliers using VAT numbers or AI-based matching (looking at name, country, and other details). We also built a check to review and adjust these matches, especially for the biggest suppliers.


2. Supplier-level Emission Factor gathering  

Once we had the suppliers matched, the next step was to pull in the actual emission factors. In Databricks, we wrote code to gather this data both at the 'Child' (the local entity) and the 'Parent' (holding) level. Since emissions can differ between a local branch and its parent company, it was important to have both.


3. Industry-level Emission Factor gathering  

Some smaller suppliers don’t report their emissions. For them, we needed another way. So, we used their NACE codes (a European industry classification) to figure out what kind of business they’re in. Then, we translated that into GICS codes (another industry standard) to get average emissions data for that industry. This gave us a reasonable estimate for suppliers without specific data.


4. Decision making & logic 

We set up rules so the system always picks the most detailed and accurate data available—whether that’s from the parent company, the local supplier, or the industry average. This means each supplier’s emissions are calculated using the best possible information. 

One challenge is timing: companies often report last year’s emissions in this year’s reports, and industry averages may lag even further behind. To deal with this, Möbius has built a mechanism that made the necessary corrections for inflations, based on the latest available information for both company & industry level Emission Factors. 


Results

To make things as user-friendly as possible, all final calculations and emissions reports were delivered in a well-structured Excel file. This file wasn’t just for viewing results,  it allowed Proximus to make manual adjustments to the decision-making logic if needed. Any changes made here had an immediate effect on the calculations, giving full control and transparency over the results.

The Excel file gave a complete breakdown of CO₂ emissions per supplier, using the most accurate emission factors available—whether based on specific supplier data or industry averages. Thanks to this detailed output, Proximus now has a much clearer view of how its spending links to carbon emissions, and how each supplier contributes to their total footprint.

This wasn’t just a one-time exercise. With the Möbius approach, the entire process can be easily repeated year after year.  This calculation not only helps Proximus for setting the baseline & SBTi-based targets, but also for keeping track of the future performance.  

Möbius played a crucial role in making this happen, guiding Proximus through the technical complexity and building a flexible solution that will support them for years to come.

Carbon footprint & scope 3 emissions: FAQ on data, tools, and calculation

What is a carbon footprint, and why is it important?
A carbon footprint measures the total greenhouse gas (GHG) emissions caused directly or indirectly by a company, product, or activity. It's a key indicator for sustainability and is essential for understanding environmental impact, setting science-based targets, and meeting reporting obligations under regulations like CSRD.
What are Scope 1, 2, and 3 emissions?
Scope 1: Direct emissions from owned sources (e.g. company vehicles, on-site fuel combustion). Scope 2: Indirect emissions from purchased electricity, heating, or cooling. Scope 3: All other indirect emissions. Especially from suppliers, purchased goods, business travel, and product use. Scope 3 is typically the largest share of a company’s footprint and the hardest to quantify.
Why is Scope 3 the hardest to track?
Scope 3 covers emissions outside a company’s direct control, including suppliers and customer behaviour. Many suppliers don’t report their emissions, data formats vary, and emissions estimates often rely on proxies like spend or industry averages. That’s why Scope 3 requires advanced data handling and estimation techniques.
How do companies calculate Scope 3 emissions using data?
Companies often start with spend data from procurement systems and match it with Emission Factors (EFs) from databases. If supplier-specific data isn’t available, industry classification codes (like NACE or GICS) are used to estimate average emissions. A decision logic layer chooses the best data available, balancing accuracy, completeness, and timeliness.
What are emission factors, and how are they used?
Emission factors are standardised values used to convert activity data (like euros spent or kilometres travelled) into carbon emissions (usually in kg or tons of CO₂-equivalent). They come from trusted databases and are either industry-wide or supplier-specific. In Scope 3, they’re essential for translating financial or operational inputs into environmental outputs.
Can carbon footprint calculation be automated?
Yes. A structured data pipeline can automate supplier matching, EF retrieval, classification mapping, and logic application. Platforms like Databricks allow companies to scale this across large datasets, minimising manual effort and ensuring year-over-year consistency.
How do you estimate emissions when suppliers don’t report them?
When supplier-specific data isn’t available, emissions are estimated using industry-level averages. This is done by mapping suppliers to NACE or GICS codes and applying corresponding emission factors. While less precise, this method ensures no data gaps and still yields valuable insights.
Why build a structured, data-driven carbon tracking system?
A structured system ensures emissions calculations are repeatable, transparent, and scalable. It helps companies comply with regulations, set credible targets, and track progress over time. Most importantly, it turns carbon accounting from a reporting task into a strategic asset for sustainability leadership.