Strategic challenge
Vaccine supply was the biggest stumbling block at the beginning of the campaign. To distribute the limited availability as optimally as possible, Möbius worked out an allocation model that translated the federal government's strategic principles into the number of vaccines that needed to be delivered per site.
Approach
How do you distribute the available vaccines across Flanders so that the vaccination coverage is equal across Flanders at all times? A seemingly simple question harbors a yet complex issue.
After all, the vaccination rate is influenced by a number of uncertain factors. Uncertainty and irregularity in the vaccine delivery, priority to risk groups, 4 vaccine types differing in target group, two doses that must be matched ... All these factors imposed additional constraints on the allocation model. Also typical logistical constraints such as batch size, safety stock and logistical flow had to be taken into account.
Using mixed integer linear programming, the optimal allocation of vaccines could be determined that took into account the above-mentioned requirements.
Results
An interactive Web application allowed operational planners to organise the vaccine distribution for the 95 vaccination centers in Flanders on a weekly basis. In addition, the dashboard included some dynamic parameters that could be adjusted based on political and clinical decision-making.
Results were automatically updated based on delivery information and vaccination coverage per municipality.
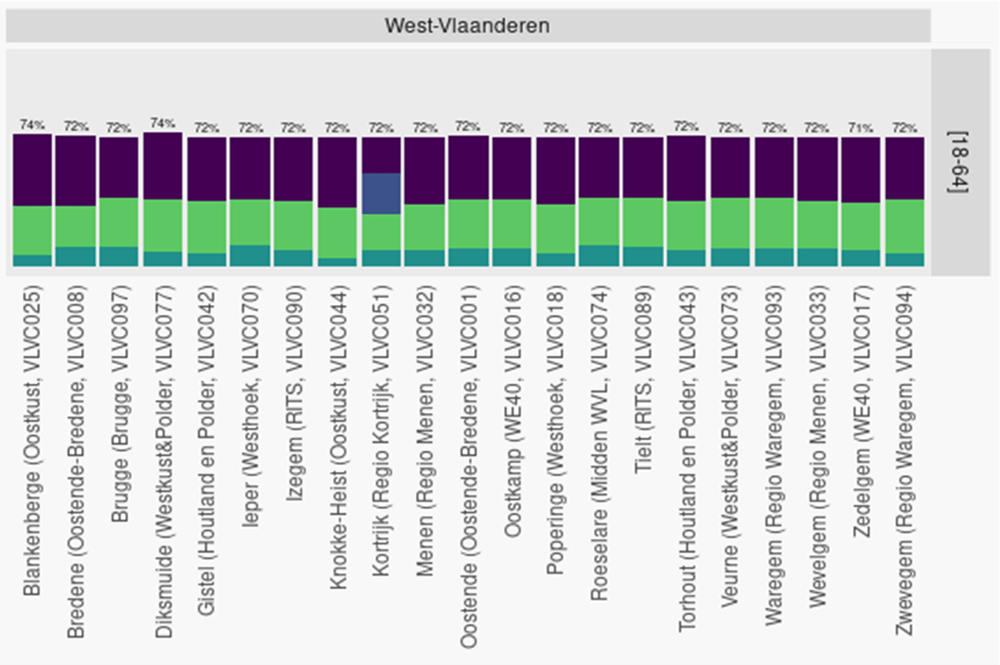
Moreover, it was possible to monitor forecasts around vaccination coverage per vaccination center (Figure below).
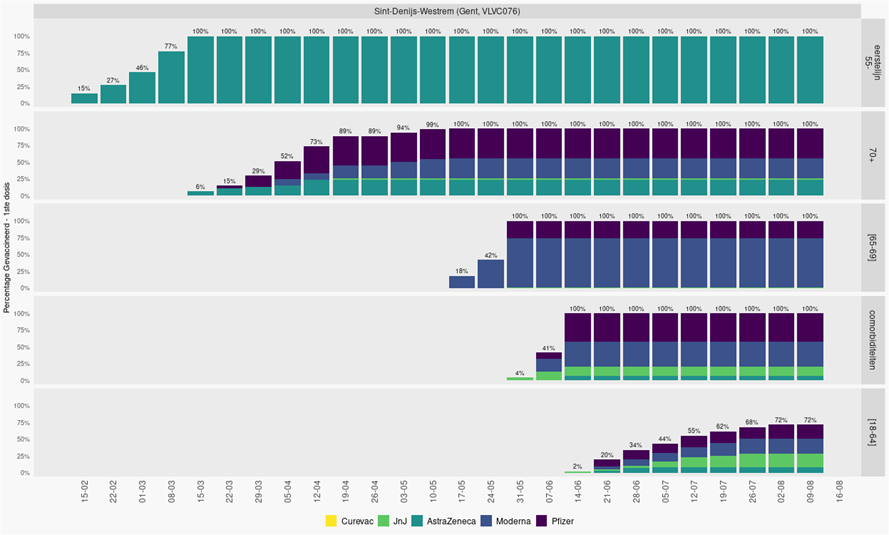
The allocation model helped make the vaccination campaign a success story, with Flanders at the top internationally in terms of overall vaccination coverage.