Insights regarding market share for each town and the evolution of the number of patients for each MDC and APR-DRG is growing in importance for hospitals, as well on a hospital level as on a network level. Möbius has built an interactive dashboard for each APR-DRG which enable hospitals to consult all information in the blink of an eye.
Dashboard functionalities
Via the dashboard, you can consult the following information for each APR-DRG:
- The market share for each town of a certain region like the attraction area of the hospital, network region, ...
- A detailed overview of the level of each individual town on the number of patients for each MDC and APR-DRG
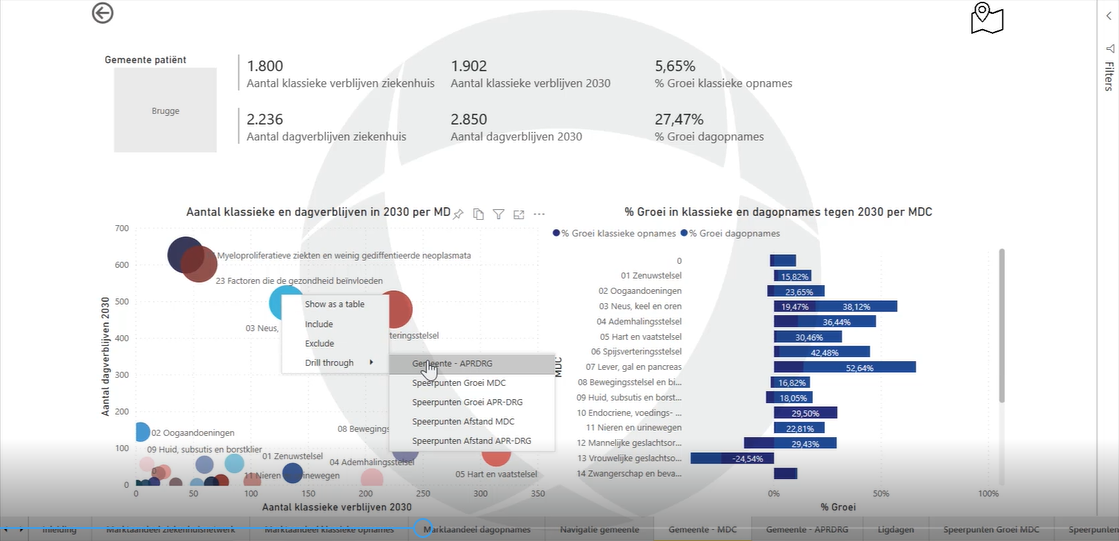
- A projection of the number of intakes for each MDC and APR-DRG before 2030, split up for individual towns
- An analysis of the current number of hospitalisation days in 2030
- The identification of a few important USP's for a hospital, based on the current market share and the estimated evolution
This dashboard for each MDC or APR-DRG takes the historical data of the hospital, demographic evolution and hospitalisation ratio into account. This is a dashboard that is specifically important in the boardroom and lets you predict the needed capacity on a network and/or hospital level. In this way, you can take the right decisions based upon the data in our dashboard.
Demo dashboard for each APR-DRG
Möbius can build personalised, interactive dashboards based on hospital-specific data. Contact us and we would love to discuss this for your specific hospital(network)!